
Decades of redlining, disinvestment, and inequitable infrastructure spending have created significant disparities in who is impacted by traffic violence, including fatal and seriously injuring traffic crashes.
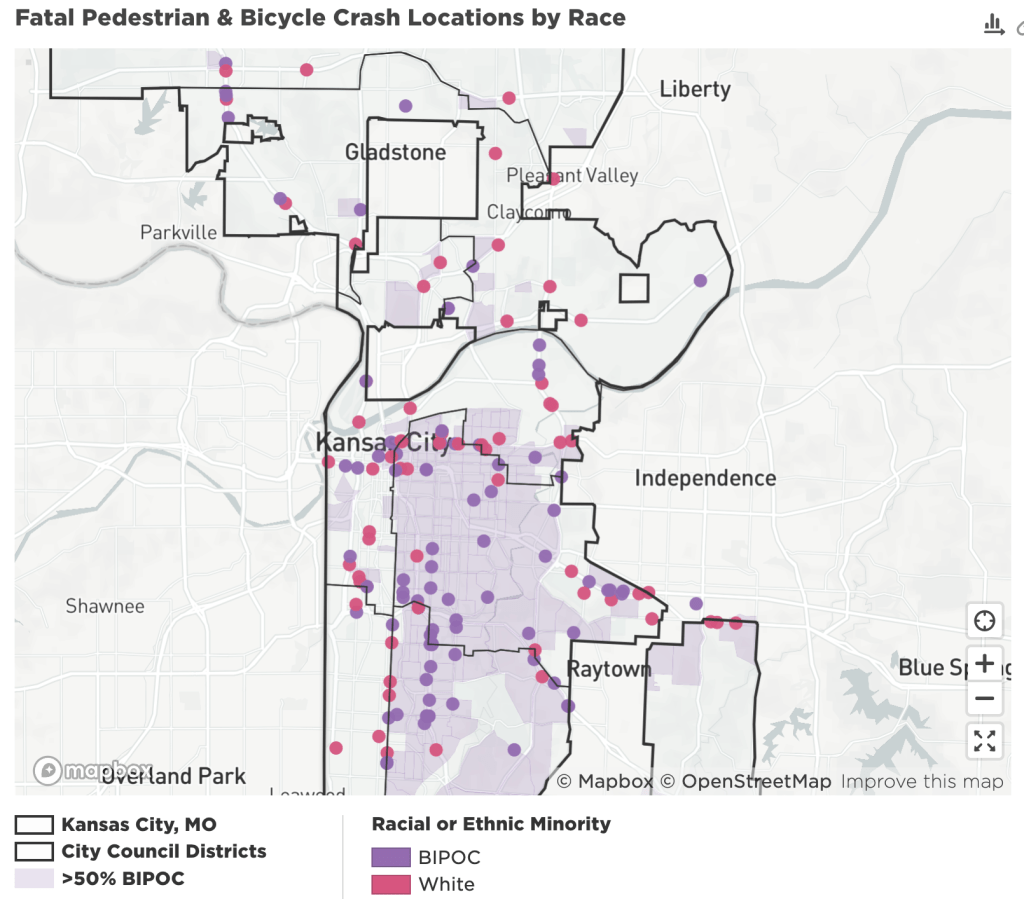
In 2022 BikeWalkKC conducted the first ever local analysis of traffic crash data and infrastructure conditions through an equity lens. Our findings show that Black and Brown Kansas Citians bear the brunt of disparities in traffic violence and poor infrastructure.
Interactive maps and charts are available on our Community Dashboard.
Black Kansas Citians are two times more likely to be killed or seriously injured in a traffic crash.
A Black child in Kansas City is six times more likely than a white child to be hit by a car and seriously or fatally injured while riding a bicycle.
Neighborhoods on the East Side and in the Historic Northeast are over-represented crashes killing or injuring pedestrians and bicyclists.
Disinvested and disadvantaged communities are significantly more likely to have lower quality and poorly maintain infrastructure.
- Sidewalks in poor condition or missing altogether
- Missing pedestrian walk signals
- Low visibility crosswalks
- Outdated traffic signals with visibility designs
- Permissive left turns that endanger pedestrians in crosswalks
43% of streets in disadvantaged areas have missing or poor sidewalks
vs
34% in non-disadvantaged areas
13% of intersections in disadvantaged areas have high-visibility crosswalks
vs
29% in non-disadvantaged areas
22% of traffic signals in disadvantaged areas are missing pedestrian walk signs
vs
11% in non-disadvantaged areas
This project was made possible with funding from the Robert Wood Johnson Foundation and the Menorah Heritage Foundation. Technical support was provided the Urban Institute and data analysis was performed by WSP. Qualitative data about the built environment was collected by residents of disinvested neighborhoods via walk audit engagements.
Research Questions
1. Is there data showing a link between health or safety disparities and problems with the built environment?
2. If yes, how do current spending patterns impact these disparities?
Methods:
1. Analyzed bike/ped crash data, demographic data, and infrastructure,
2. reviewed capital spending in Kansas City, Missouri
3. organized community walk audits along dangerous corridors to observe elements of the built environment contributing to crashes.
Data Sources (years 2010-2019)
1. Crash data from the Mid-America Regional Council, the local Metropolitan Planning Organization
2. National Highway Safety Administration’s Fatality Analysis Reporting System (FARS)
How we define "Equity Areas"
- Transportation access
- Health disadvantage
- Environmental disadvantage
- Economic disadvantage
- Resilience disadvantage (i.e., climate
- hazards exposure)
- Linguistic isolation
- Race and ethnicity
- Life expectancy
Interactive maps and charts are available on our Community Dashboard.
